An article in yesterday’s The Australian by Maurice Newman, Chairman of the Prime Minister’s Business Advisory Council, has raised the question as to whether it was seen by Abbott before publication (article attached). The Fairfax press has been so stirred that it has published a call by Labor’s acting environment spokesman for Abbott to order Newman to withdraw his “ignorant comments” (The Age, “Heat is on Abbott adviser for his warming denial”, 1Jan). But while one or two of Newman’s comments are extravagant, the article deserves the urgent attention of the Abbott government as it highlights the now extensive uncertainties about the analytical basis of the IPCC’ s reports. These are of course totally ignored by Fairfax press and the ABC.
As my letter below (published in today’s The Australian) also points out, the government policies based on IPCC analyses are undoubtedly having adverse effects on the economy and those policies warrant urgent review. The government has promised an inquiry into policies which subsidise renewable energy but it is reported that there is internal haggling over the terms of reference. But the question is – why limit an inquiry to RETs?
One way to go would be to have a Parliamentary Inquiry into the costs and benefits of all government policies which are based on the IPCC theory that fossil fuel usage must be reduced if dangerous warming is to be avoided. Such an inquiry could be timed to report to allow policy changes to be announced in the May 2014 budget and implemented next financial year when the Senate should be more amenable to change. Just as Canada and Japan have done, Australia can justify making major changes in its environment policies.
There are many reasons for questioning the IPCC theory but the absence of any warming over the past 17 years in the face of increased emissions surely, on its own, provides a justifiable starting point for such an inquiry. Below is a telling analysis by Lord Monckton on what has happened to temperatures over the last 17 years.
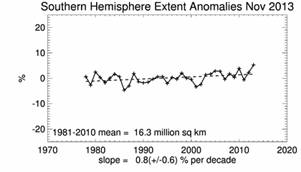
Another rather amusing (but concerning) development is the sticking in ice in the Antarctic of a ship carrying 74 climate scientists, with a professor of climate change at the University of NSW managing a trip similar to that taken by Mawson in 1912. As is now to be expected from Australian media reports, only one source has indicated that these travellers are climate scientists and none have explained that their objective appears to have been to “prove” that the ice is melting. One small glance at the recent trend in the extent of Antarctic ice would have shown that the extent of ice appears to be the greatest over the past thirty odd years and should have warned even these scientists that they would experience ice problems – see graph below. Now they have to be rescued at great expense - but to whom?
Des Moore
Costs of climate policies inflated by research waste
(Letter by Des Moore published in The Australian, 1 January 2014.)
[square bracketed sentence deleted by Editor]
Maurice Newman draws attention to the many uncertainties surrounding the scientific analyses published by the UN’s Intergovernmental Panel on Climate Change and the increasing scepticism in the community about government policies based on this body’s reports.
There is particular concern that policies involving renewable energy subsidisation and restrictions on usage of fossil fuels and on seaside property developments have been adopted without any cost/benefit study.
Now, a group of climate scientists whose ship is locked in ice in the Antarctic appear to be unaware of the greater ice extent there than when Mawson experienced an ice free situation in 1912.
The growing uncertainty about existing government policies and their adverse effects on our economy has inspired petitions calling for an urgent parliamentary inquiry. [It is hoped that this will commence when Parliament resumes.]
Des Moore, South Yarra Vic
Whither went the warmer weather?
(posted by Anthony Watts 16 December 2013.)
17 years, 3 months with no global warming
by Christopher Monckton of Brenchley
The Long Pause just got three months longer. Last month, the RSS monthly global mean lower-troposphere temperature anomalies showed no global warming for exactly 204 months – the first dataset to show the full 17 years without warming specified by Santer as demonstrating that the models are in fundamental error.
The sharp drop in global temperature in the past month has made itself felt, and not just in the deep snow across much of North America and the Middle East. The RSS data to November 2013, just available after a delay caused by trouble with the on-board ephemeris on one of the satellites, show no global warming at all for 17 years 3 months.
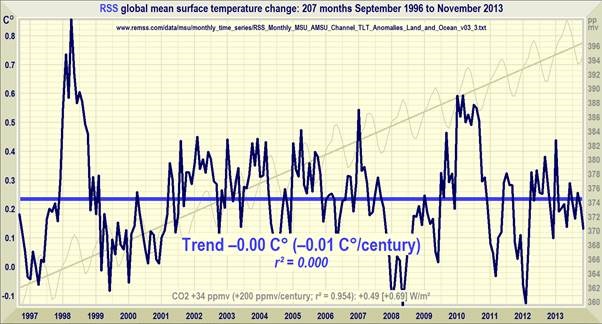
It is intriguing, and disturbing, that WattsUpWithThat is just about the only place where you will be allowed to see this or any graph showing the spectacularly zero trend line through 207 continuous months of data.
CO2 concentration continues to climb. Global temperature doesn’t. Absence of correlation necessarily implies absence of causation. Game over, logically speaking.
On any objective test of newsworthiness, the fact of 17 years 3 months with no global warming is surely of more than passing interest to audiences who have been terrified, over and over again, by the over-confident proclamations of the true-believers that catastrophic global warming was the surest of sure things.
Yet the mainstream news media, having backed the wrong horse, cannot bear to tear up their betting slips and move along. They thought they had a hot tip on global warming. They were naïve enough to believe Scientists Say was a dead cert. Yet the spavined nag on which they had bet the ranch fell at the first fence.
The inventiveness with which They wriggle is impressive. Maybe all that air pollution from China is like a parasol. Maybe the warming somehow snuck sneakily past the upper 2000 feet of the ocean so that it didn’t notice, and perhaps it’s lurking in the benthic strata where we can’t measure it. Maybe it’s just waiting to come out when we least expect it and say, “Boo!”.
Anyway, so the wrigglers say, The World Is Still Warming. It must be, because The Models Say So. They say our adding CO2 to the atmosphere is the same as Blowing up Four Whole Atom Bombs Somewhere On Earth Every Second!!!! Just imagine all that HEAT!
Well, it isn’t real. “Imagine” is the right word. If the world were warming, the most sensitive indicator of that warming would be the atmosphere itself. Since the atmosphere has not been warming for 17 years 3 months, an awful possibility is beginning to dawn on even the dimmest of the climate extremists – or, at least, those of them who have somehow found out about the Long Pause.
Maybe natural influences are still strong enough to pull in the other direction and cancel the predicted warming. Maybe the models got the forcing wrong, or the feedbacks wrong, or the climate-sensitivity parameter wrong, or the amplification equation wrong, or the non-radiative transports wrong.
Maybe – heresy of heresies – CO2 is just not that big of a deal any more.
Yet it ought to be having some effect. All other things being equal, even without temperature feedbacks we should be seeing 1 Celsius degree of global warming for every doubling of CO2 concentration.
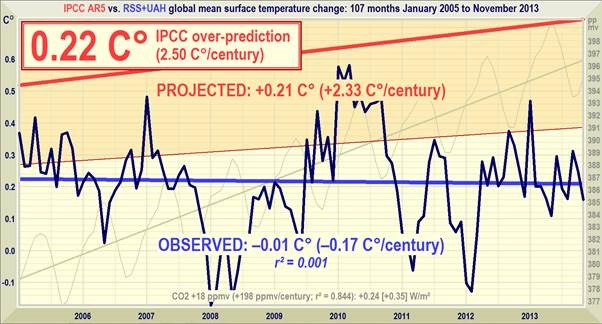
It is more likely than not that global warming will return eventually. Not at the predicted rate, but it will return. It would be wisest, then, to look not only at the now embarrassingly lengthening Long Pause but also at the now embarrassingly widening Gaping Gap between the +0.23 Celsius/decade predicted by the models for the first half of this century and the 0.02 Celsius/decade that is actually happening.
The Extent of Ice In Antarctic
Following is a graph showing data from National Snow and Ice Data Center on the extent of ice in the Antarctic over the past 30 years (the maximum extent occurs in September and the minima in February). Note that the slopes for the fitted straight lines give the change per decade.
The 30 year net global changes in maximum and minimum ice extent are -0.1 +/- 0.1 million sq km and -0.4+/- 0.2 million sq km.
This is not a statistically significant change.
However, the extent of sea ice in November shows an increasing area and appears to be the greatest for the whole period covered.